-
AnyChart - fast, simple and flexible JavaScript (HTML5) charting library featuring pure JS API.
-
Echarts - Baidus enterprise charts.
-
D3 - javaScript library for manipulating documents.
-
Bokeh - A powerful Python interactive visualization library that targets modern web browsers for presentation, with the goal of providing elegant, concise construction of novel graphics in the style of D3.js, but also delivering this capability with high-performance interactivity over very large or streaming datasets.
-
CartoDB - open-source or freemium hosting for geospatial databases with powerful front-end editing capabilities and a robust API.
-
Chart.js - open source HTML5 Charts visualizations.
-
D3.compose - Compose complex, data-driven visualizations from reusable charts and components.
-
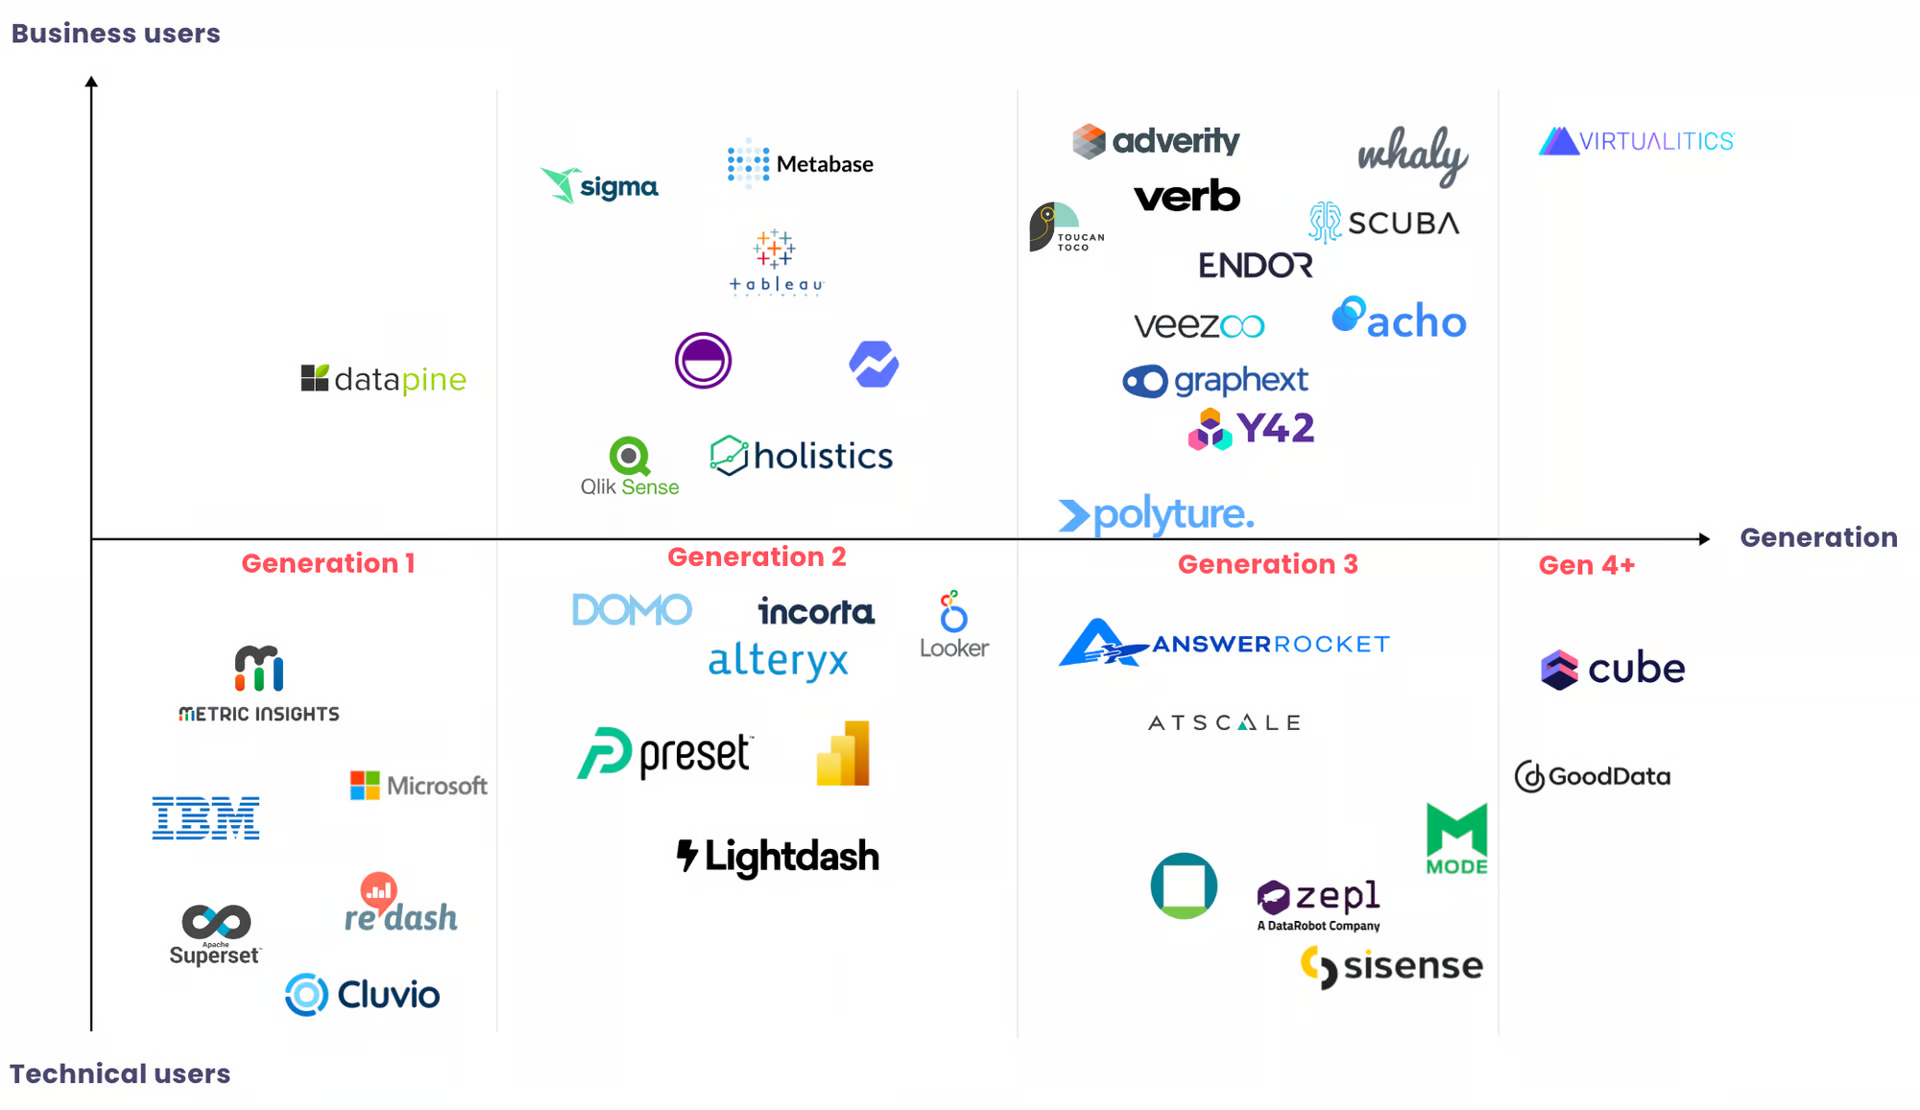
Dash - Analytical Web Apps for Python, R, Julia, and Jupyter. Built on top of plotly, no JS required
-
Zeppelin - a notebook-style collaborative data analysis.
-
Superset - a data exploration platform designed to be visual, intuitive and interactive, making it easy to slice, dice and visualize data and perform analytics at the speed of thought.
-
DC.js - Dimensional charting built to work natively with crossfilter rendered using d3.js. Excellent for connecting charts/additional metadata to hover events in D3.
-
Banana - visualize logs and time-stamped data stored in Solr. Port of Kibana.
-
Bloomery - Web UI for Impala.
-
C3 - D3-based reusable chart library
-
chartd - responsive, retina-compatible charts with just an img tag.
-
Crossfilter - JavaScript library for exploring large multivariate datasets in the browser. Works well with dc.js and d3.js.
-
Cytoscape - JavaScript library for visualizing complex networks.
-
D3Plus - A fairly robust set of reusable charts and styles for d3.js.
-
Dash - Analytical Web Apps for Python, R, Julia, and Jupyter. Built on top of plotly, no JS required
-
Dekart - Large scale geospatial analytics for Google BigQuery based on Kepler.gl.
-
DevExtreme React Chart - High-performance plugin-based React chart for Bootstrap and Material Design.
-
Envisionjs - dynamic HTML5 visualization.
-
FnordMetric - write SQL queries that return SVG charts rather than tables
-
Frappe Charts - GitHub-inspired simple and modern SVG charts for the web with zero dependencies.
-
Freeboard - pen source real-time dashboard builder for IOT and other web mashups.
-
Gephi - An award-winning open-source platform for visualizing and manipulating large graphs and network connections. It’s like Photoshop, but for graphs. Available for Windows and Mac OS X.
-
Google Charts - simple charting API.
-
Grafana - graphite dashboard frontend, editor and graph composer.
-
Graphite - scalable Realtime Graphing.
-
Highcharts - simple and flexible charting API.
-
IPython - provides a rich architecture for interactive computing.
-
Kibana - visualize logs and time-stamped data
-
Lumify - open source big data analysis and visualization platform
-
Matplotlib - plotting with Python.
-
Metricsgraphic.js - a library built on top of D3 that is optimized for time-series data
-
NVD3 - chart components for d3.js.
-
Peity - Progressive SVG bar, line and pie charts.
-
Plot.ly - Easy-to-use web service that allows for rapid creation of complex charts, from heatmaps to histograms. Upload data to create and style charts with Plotly’s online spreadsheet. Fork others’ plots.
-
Plotly.js The open source javascript graphing library that powers plotly.
-
Recline - simple but powerful library for building data applications in pure Javascript and HTML.
-
Redash - open-source platform to query and visualize data.
-
ReCharts - A composable charting library built on React components
-
Shiny - a web application framework for R.
-
Sigma.js - JavaScript library dedicated to graph drawing.
-
Vega - a visualization grammar.
-
Zing Charts - JavaScript charting library for big data.
-
DataSphere Studio - one-stop data application development management portal.